
NHGIS provides three types of data describing U.S. watersheds:
- Boundaries for hydrologic units (in shapefiles)
- Estimates of 2010 and 2020 population and housing characteristics of hydrologic units
- Crosswalks from 2010 and 2020 census blocks to hydrologic units
Page Contents
Overview
Investigations of human-environment interactions often require understanding how populations are distributed at environmental scales. Population data, however, are usually collected and reported for administrative and statistical units that do not align with environmental zones. There are many ways analysts can allocate data from one set of units to another, but the most effective methods can be cumbersome and confusing for inexperienced researchers.
To address this issue, NHGIS has produced estimates of several commonly studied population and housing characteristics for three levels of watersheds throughout the contiguous U.S. We provide these estimates here along with two other related products: watershed boundary data (for mapping and spatial analysis) and crosswalks from census blocks to watersheds (enabling analysts to compute estimates of watershed characteristics for population and housing subgroups that are not included in the provided estimates).
Technical Details
Hydrologic Unit Levels, Codes & Coverage
Each of the three types of NHGIS watershed data (boundaries, estimates, and crosswalks) includes information for three levels of hydrologic units, as defined by the hierarchical system of hydrologic unit codes (HUCs) established by the United States Geological Service (USGS).
Level ID | Name | Digits in Code | Number of Units* | Average Size (Sq Mi)* |
|---|---|---|---|---|
HUC-8 | Subbasins | 8 | 2,232 | 1,576 |
HUC-10 | Watersheds | 10 | 16,387 | 217 |
HUC-12 | Subwatersheds | 12 | 88,461 | 40.3 |
* These statistics describe the complete source unit definitions from the USGS.
At each level, a unit's code consists of the identifier of its containing unit at the next highest level followed by two additional digits. For example, a HUC-12 subwatershed code consists of 12 digits, of which the first 10 digits identify the HUC-10 watershed that contains the subwatershed.
NHGIS modifies the original USGS unit definitions by clipping them to the interior of the contiguous U.S. and dividing units that cross state lines into separate state-specific parts, creating watershed-by-state units.
In the NHGIS datasets, each of these units has a unique identifier (GISJOIN), which is a concatenation of three components:
- A "G" prefix
- Beginning with a text character ("G") helps to ensure that software will read the IDs as text strings, not as numbers, which preserves any leading zeros
- The NHGIS state code
- NHGIS state codes are based on FIPS codes with one digit added to differentiate historical areas. For currently existing entities, the added digit is "0", so the NHGIS code matches the FIPS code with a "0" appended.
- The USGS hydrologic unit code
Users who wish to analyze complete hydrologic units can aggregate records across states by dissolving or grouping by the hydrologic unit code (e.g., HUC08). The watershed shapefiles also contain a field (STATES) that lists all the states associated with each hydrologic unit.
Year Coverage
For each watershed data type at each hydrologic unit level, NHGIS provides information for two census years: 2010 and 2020.
The 2010 and 2020 shapefiles differ only by using, respectively, 2010 and 2020 TIGER/Line definitions of state boundaries.
Estimated Population & Housing Counts
The estimates files cover these characteristics:
- Total population
- Population by urban/rural status
- Population by Hispanic or Latino origin by race [7 race categories]
- Population by sex by age [23 age categories]
- Households by household type [8 categories & subcategories]
- Total housing units
- Housing units by occupancy status
- Occupied housing units by tenure and mortgage status
- Occupied housing units by household size [7 categories]
This set covers all the characteristics in the 11 tables that NHGIS users have downloaded most often from both 2010 and 2020 census datasets. The specific estimated variables are listed in the README files that accompany the estimates files.
File Organization & READMEs
- The boundary data are provided as shapefiles
- The estimates and crosswalks are provided in CSV (comma-separated values) files
- Each dataset is provided in a Zip archive file
- Each Zip file contains a data file (or files) along with a README text file, which describes the structure and content of the data files in detail
- The README files are also available here:
Interpolation Model
The estimates and crosswalk weights are based on a dasymetric interpolation model adapted from the binary dasymetric model that NHGIS uses for its 2000 data in time series tables standardized to 2010 census units (Schroeder 2017). Dasymetric models incorporate secondary information in order to more precisely apportion populations within their areal units prior to interpolation.
For the watersheds model, we use multiple sources to restrict 2010 and 2020 census block areas to sub-regions of probable inhabitance based on road, water, and impervious surface information, following these steps:
- Start with full census block: We began with the original unrestricted census block polygon as represented in NHGIS boundary files for 2010 and 2020 blocks.
- Restrict to land area: We then removed clearly non-habitable areas by subtracting water features such as lakes and rivers, producing a land-only version of the block.
- Restrict to buffered road area: Next we identified road segments within and near the block and applied 300-foot buffers, assuming development is likely to occur near transportation infrastructure. We evaluated road types hierarchically:
- When possible, we restricted the land-only block area to within 300 feet of local road and private driveway road types, assuming these better reflect residential settlement patterns.
- If no local road or private driveway road types were present, we restricted the land-only block area to within 300 feet of primary and secondary road types.
- Restrict to land with impervious surfaces: Within buffered road areas, we identified all areas with impervious surface measurements of at least 5%, assuming this to be an indicator of built development.
- If impervious surfaces were present, we further restricted the buffered-road areas of the block to these impervious areas.
- If no impervious surfaces were present, we did not further restrict the buffered-road areas of the block.
- Fallback options:
- If no qualifying roads existed, we restricted the land-only block to any areas with at least 5% imperviousness.
- If neither roads nor impervious surfaces were found, or if any restriction step failed, we restricted the block to its land area only.
- If the block contained no land area, we imposed no restrictions.
The resulting restricted census block polygons provided refined estimates of the inhabited footprint within each block (Figure 1) while still preserving full coverage where necessary. We computed the areas of the restricted extents for each 2010 and 2020 block and for their intersections with watershed polygons, and we used these areas to compute the interpolation weights in the crosswalks. We then used the crosswalk weights to estimate watershed-level 2010 and 2020 census population and housing characteristics.
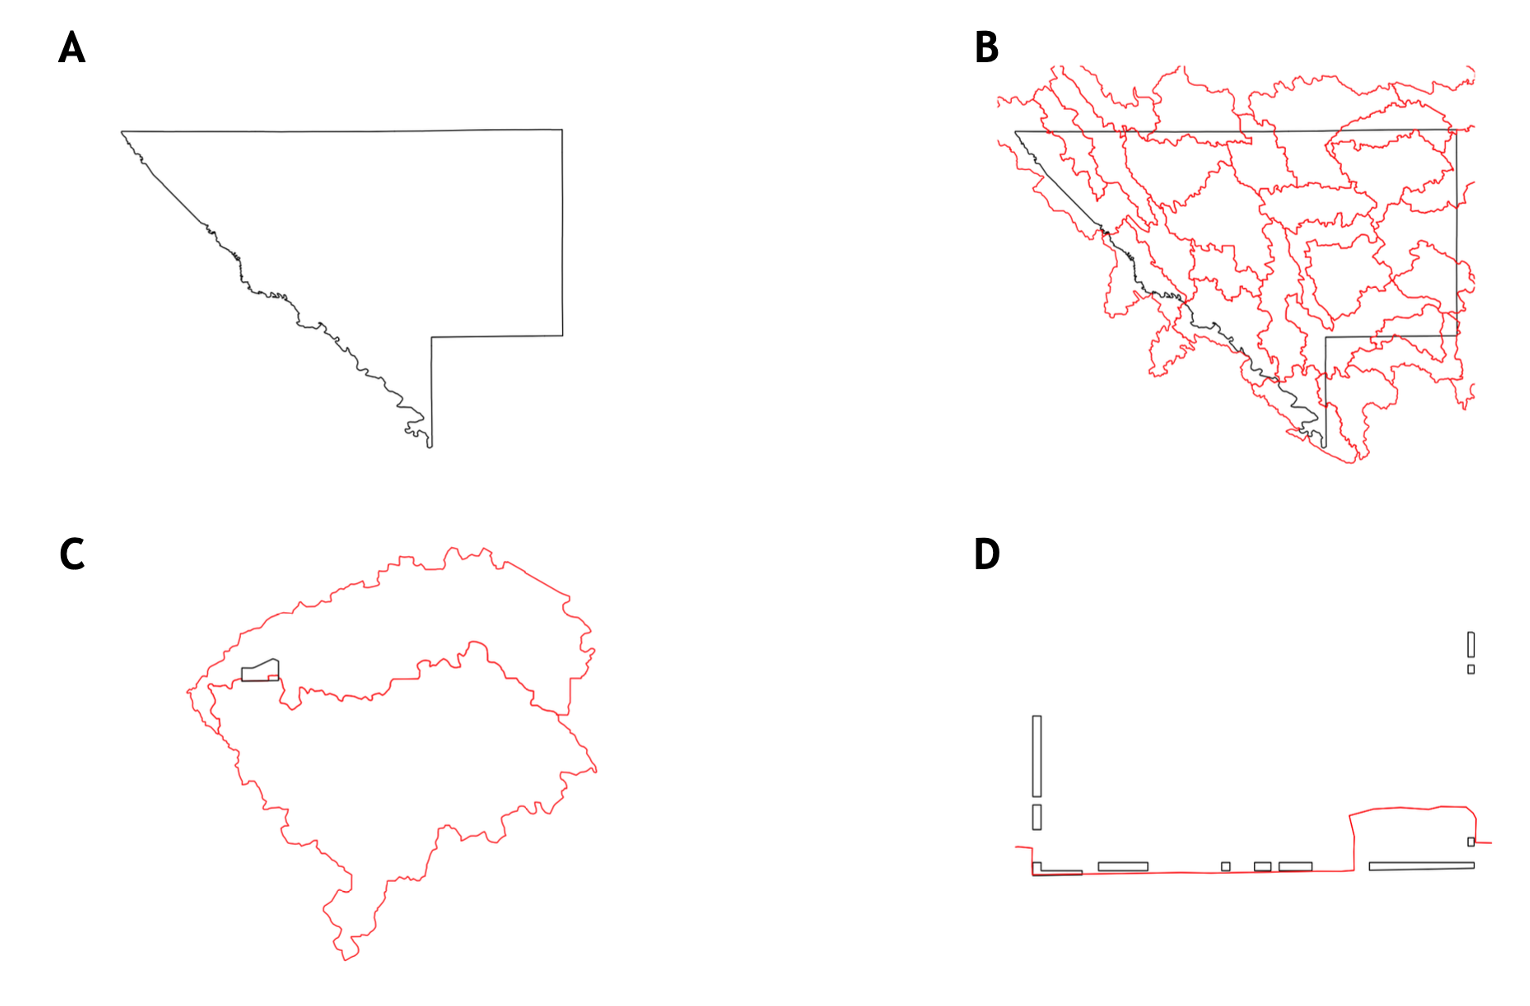
Figure 1. An example of dasymetric interpolation from U.S. census blocks to USGS hydrologic units in Chippewa County, Minnesota: (A) the county's administrative boundary, (B) the many subwatersheds (outlined in red) that intersect the county, (C) an example within the county of a block (outlined in black) that spans multiple subwatersheds, and (D) the extent within that block of the dasymetric model's restricted zone (outlined in black) relative to the subwatershed boundary (in red). By restricting the interpolation to sub-regions of probable inhabitance, we can better apportion block-level population and housing data estimates to each subwatershed.
Source Data
The development of these products relied on several primary national datasets:
- Census data: 2010 and 2020 block-level population and housing information from 2010 Census Summary File 1 (SF1) tables P2, P5, P12, P18, H3, H4, and H13, and 2020 Census Demographic and Housing Characteristics (DHC) File tables P2, P5, P12, P16, H3, H4, and H9.
- Census block polygons: 2010 and 2020 blocks from NHGIS boundary files based on 2010 and 2020 TIGER/Line boundaries, respectively.
- Hydrologic unit boundaries: USGS National Watershed Boundary Dataset (obtained 2025). Note: We assumed consistent watershed boundaries over time, and while watershed boundaries are based on relatively stable topographic ridgelines, these boundaries can change through natural processes like erosion, floods, and fire, as well as human activities such as urbanization, infrastructure development (dams, roads, pipelines), and deforestation.
- Roads and water features: 2010 and 2020 TIGER/Line Shapefiles from the United States Census Bureau. Road files include primary, secondary, local, and private driveway classes, and water files represent lakes, rivers, and other surface water features.
- Impervious surfaces: 2010 and 2020 data from the Multi-Resolution Land Characteristics Consortium (MRLC) National Land Cover Database (NLCD) impervious-surface raster data. These 30-meter resolution rasters map the percentage of impervious surfaces—such as roads, rooftops, and parking lots—across the U.S. We used the 2010 NLCD for 2010 blocks and the 2020 NLCD for 2020 blocks.
By combining impervious surfaces, roads, water features, and census block boundaries from the same year, the model produces consistent, year-specific estimates of inhabited land within each block.
Downloads
The watershed summaries are available to registered NHGIS users through the links below.
Boundaries
Subbasins (HUC-8)
Shapefiles of HUC-8 subbasins-by-state for the contiguous United States.
Census year 2020 | ||
|---|---|---|
Census year 2010 | ||
|---|---|---|
Watersheds (HUC-10)
Shapefiles of HUC-10 watersheds-by-state for the contiguous United States.
Census year 2020 | ||
|---|---|---|
Census year 2010 | ||
|---|---|---|
Subwatersheds (HUC-12)
Shapefiles of HUC-12 subwatersheds-by-state for the contiguous United States.
Census year 2020 | ||
|---|---|---|
Census year 2010 | ||
|---|---|---|
Estimates
Subbasins (HUC-8)
Population & housing estimates for HUC-8 subbasins-by-state for the contiguous United States.
Census year 2020 | ||
|---|---|---|
Census year 2010 | ||
|---|---|---|
Watersheds (HUC-10)
Population & housing estimates for HUC-10 watersheds-by-state for the contiguous United States.
Census year 2020 | ||
|---|---|---|
Census year 2010 | ||
|---|---|---|
Subwatersheds (HUC-12)
Population & housing estimates for HUC-12 subwatersheds-by-state for the contiguous United States.
Census year 2020 | ||
|---|---|---|
Census year 2010 | ||
|---|---|---|
Crosswalks
Census Blocks → Subbasins (HUC-8)
Crosswalks from census blocks to HUC-8 subbasins-by-state for the contiguous United States.
Census year 2020 | ||
|---|---|---|
Census year 2010 | ||
|---|---|---|
Census Blocks → Watersheds (HUC-10)
Crosswalks from census blocks to HUC-10 watersheds-by-state for the contiguous United States.
Census year 2020 | ||
|---|---|---|
Census year 2010 | ||
|---|---|---|
Census Blocks → Subwatersheds (HUC-12)
Crosswalks from census blocks to HUC-12 subwatersheds-by-state for the contiguous United States.
Census year 2020 | ||
|---|---|---|
Census year 2010 | ||
|---|---|---|
Citation and Use
Use of the NHGIS watershed data summaries is subject to the same conditions as for all NHGIS data. See NHGIS Citation and Use.
Credits
The original conception of this product and the implementation of the interpolation model were completed independently by Ryan Gavin with limited guidance from NHGIS researcher Jonathan Schroeder. Gavin later completed the final products and prepared documentation under Schroeder's supervision as an NHGIS graduate assistant in 2026.
References
- ^ Schroeder, J. P. (2017). Hybrid areal interpolation of census counts from 2000 blocks to 2010 geographies. Computers, Environment and Urban Systems, 62, 53-63. https://doi.org/10.1016/j.compenvurbsys.2016.10.001