NHGIS geographic crosswalks describe how U.S. census summary data from one year correspond to geographic units for another year. The crosswalks are designed to support high-quality tabulations of one year's data for another year's geographic units (e.g., 1990 foreign-born population for 2010 census tracts).
NHGIS crosswalks are similar to the U.S. Census Bureau's Relationship Files, but NHGIS crosswalks include interpolation weights derived from advanced models. Each interpolation weight indicates the proportion of a source zone's characteristics to allocate to a specific target zone. We use these same weights to produce NHGIS geographically standardized time series tables.
- Available Crosswalks
- Selecting a Crosswalk
- How to Use the Crosswalks
- Technical Details
- Downloads
- Crosswalks to Blocks
- Crosswalks to Block Groups
- Crosswalks to Census Tracts
- Crosswalks to Core Based (Metropolitan/Micropolitan) Statistical Areas (CBSAs)
- Crosswalks to Counties
- Crosswalks to County Subdivisions
- Crosswalks to Places
- Crosswalks to Public Use Microdata Areas (PUMAs)
- Crosswalks to Urban Areas
- Crosswalks to ZIP Code Tabulation Area (ZCTAs)
- Download via API
- Citation and Use
- References
Available Crosswalks
Crosswalks by Geographic Level & Year
Target Zones | Source Zones | Target Year in 2010s | Target Year in 2020s | ||
|---|---|---|---|---|---|
1990 to 2010s | 2000 to 2010s | 2020s to 2010s | 2010s to 2020s | ||
Blocks | X | X | X | X | |
Blocks | X | X | X | X | |
Block Group Parts | X | X |
|
| |
Block Groups |
|
| X | X | |
Blocks | X | X | X | X | |
Block Group Parts | X | X |
|
| |
Block Groups |
|
| X | X | |
Census Tracts | X | X | X | X | |
Blocks | X | X | X | X | |
CBSAs: Core Based (Metropolitan/Micropolitan) Statistical Areas
PUMAs: Public Use Microdata Areas
ZCTAs: ZIP Code Tabulation Areas
Crosswalks for Non-Census Years: 2011 & Beyond
Most NHGIS crosswalks are for pairs of census years, corresponding to different definitions of census geographic units (e.g., 1990 census tracts and 2010 census tracts).
For block groups, census tracts, and counties, we also provide crosswalks for some non-census years: 2011, 2012, 2014, 2015, and 2022.
These are the only non-census years when there were substantial changes in the block groups, census tracts, or counties identified in American Community Survey (ACS) 5-year data.
For more information about these changes, see the Census Bureau's ACS Geography Changes pages:
- 2011: Some tracts & block groups in three New York counties
- 2012: Some tracts & block groups in Pima County, AZ, and Los Angeles County, CA
- 2014: Some counties, tracts & block groups in Alaska and Virginia
- 2015: Some counties, tracts & block groups in Alaska and South Dakota
- 2022: All counties, tracts & block groups in Connecticut
The most impactful of these changes occurred in 2022, when the Census Bureau switched from identifying Connecticut's eight historical counties to a distinct set of nine county-equivalent planning regions. This update caused no changes in the land extents of block groups or census tracts, but because the full identifiers of block groups and census tracts include a county code, the county-level changes resulted in new identifiers for all Connecticut block groups and census tracts.
The full set of crosswalks enables users to standardize geographic units for census and ACS data for the entire period of 1990 through the present, with one exception: we have not yet added crosswalks for 2009, so the crosswalks cannot be used with all data from the earliest release of ACS 5-year estimates, covering 2005-2009. (Most of the block groups and tracts identified in the 2009 5-Year ACS summary tables correspond to the 2000 census definitions, but according to ACS documentation, "in 19 counties from 8 different states, many of the census tracts and block groups used to tabulate and present the 2005-2009 ACS 5-year estimates are either those submitted to the Census Bureau for the 2010 Census, or a preliminary version of 2010 Census definitions.") We may add crosswalks for 2009 in a future release.
At this time, NHGIS crosswalks cover only pairs of years from different decades (e.g., 2012 and 2022, but not 2020 and 2022). If you need a crosswalk between 2020 and 2022 units in Connecticut, we recommend CTData's 2020-2022 crosswalks for census tracts or blocks, or you can obtain a correspondence file between any 2020 census units and the 2022 Connecticut planning regions via Geocorr 2022.
We currently have no plans to add crosswalks for non-census years for other geographic levels.
Selecting a Crosswalk
Important: Start from the Lowest Level You Can
To transform summary data from one census's geographic units to another's, it's important to start from the lowest possible level.
Let's say you'd like "harmonized tract data": multiple years of data for spatially consistent census tracts. So you obtained 1990, 2000, 2010, and 2020 tract data, and now you'd like to use a tract crosswalk to standardize the geographic units. But there are lots of data available for units smaller than tracts, like blocks and block groups. And these smaller units fit much better within other years' tracts, so why not start with data from the smaller units?
If you allocate data from blocks or block groups to a single year's tract boundaries, you'll still produce "harmonized tract data," but it'll be more accurate than if you started with tract data, and sometimes much more.
For example, there are thousands of cases where a single 1990 census tract corresponds to multiple 2010 tracts. This is especially common in fast-growing areas on the outskirts of cities, as in Figure 1. To tabulate 1990 data for the 2010 tracts in these cases, starting from tract counts requires disaggregating counts from the larger 1990 tracts down to their component parts, which can result in substantial errors.
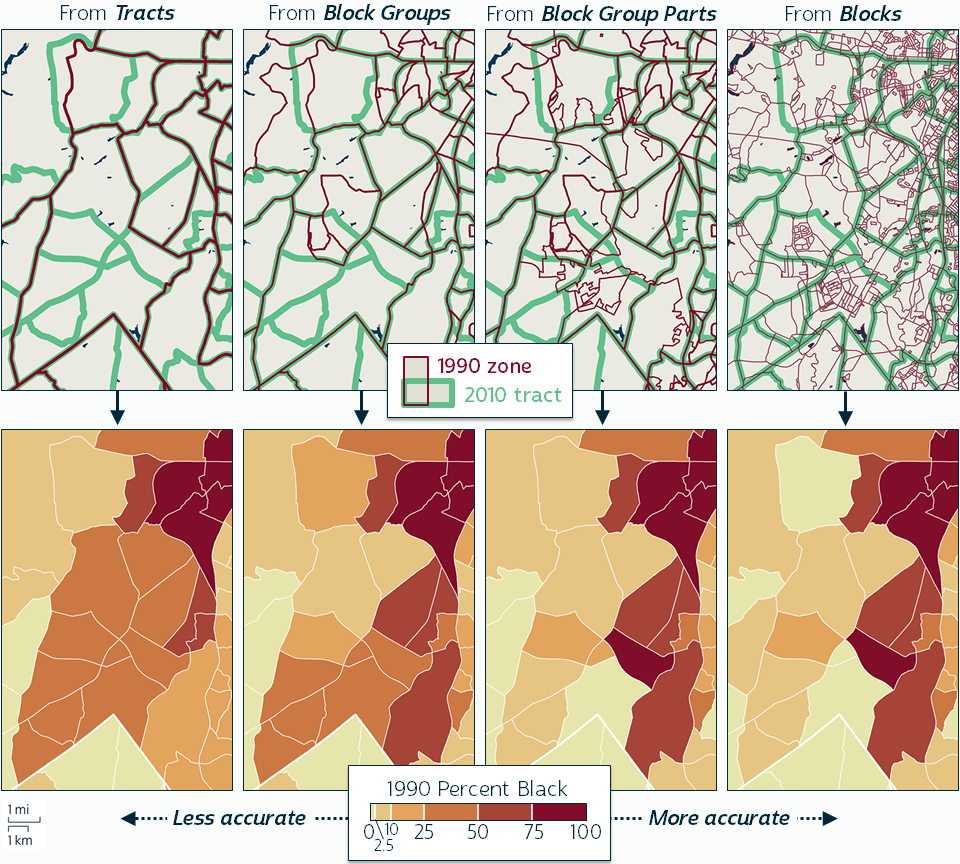
Figure 1. Computing 1990 rates of Black residents in 2010 tracts from different source levels, on the southwest outskirts of Charlotte, NC. Click for larger version. Source for tract-based estimates: Longitudinal Tract Database (LTDB).
Disaggregation models commonly assume that population characteristics are uniformly distributed within source zones, resulting in inaccurately uniform distributions among the target zones. This is evident in the tract-based estimates of the 1990 Black population distribution in Figure 1, which indicate that this area was moderately well integrated.
In this case, there is no need to start with tract data. The Census Bureau also published 1990 race data for blocks, block groups, and block group parts. Allocating data from these levels requires less disaggregation, and in many cases it requires only aggregation, resulting in exact 1990 counts for the 2010 tracts. In Figure 1, the allocations from the lower levels reveal that this area's population was in fact strongly segregated in 1990, with high rates of Black population in the eastern 2010 tracts and low rates in the western 2010 tracts.
Options & Recommendations
Determining the best (lowest) source level to use for a crosswalk application depends on whether the characteristics of interest are covered in the full-count, short-form census or only in sample-based, long-form surveys.
From 1970 to 2000, the decennial census used two questionnaires:
- A short-form questionnaire, to be completed for all population and housing units, covering subjects such as age, sex, race, household size, and housing tenure.
- A long-form questionnaire, sent only to a sample of households, covering subjects such as income, employment, education, nativity, migration, and commuting.
After the 2000 census, the Census Bureau stopped including the long form in decennial census operations and has instead collected comparable information through the year-round American Community Survey (ACS). The Bureau publishes summary tables from the ACS annually. To generate a large enough sample to report data for small areas, it pools 5 years of samples together, producing 5-year summary data.
- Blocks are the lowest level for which the Census Bureau tabulates full-count, short-form summary data
- This includes most data tables from the 2010 and 2020 censuses along with most tables from Summary Files 1 and 2 for the 1990 and 2000 censuses
- Block group parts are the lowest level for which the Census Bureau tabulated sample-based, long-form summary data in 1990 and 2000 (Summary Files 3 and 4)
- Block groups are the lowest level in ACS 5-year summary tables*
- Census tracts are the lowest level for some detailed census and ACS summary tables**
*The ACS also provides data for many entities that are smaller than block groups, such as small villages and tribal areas, but unlike these areas, block groups cover the entire U.S. and are uniformly small, with no great exceptions.
**Sex by single year of age and detailed place of birth are example tabulations for which there is usually no data available for levels lower than census tract. In decennial census summary files, such tables have codes that include "CT" (e.g., "PCT12" for the 2020 Sex by Single-Year Age table). ACS summary tables do not use a distinct code for these cases, but NHGIS distinguishes them by grouping them in separate datasets. (For example, the tables in the NHGIS 2016_2020_ACS5a dataset provide data for block groups, and the tables in 2016_2020_ACS5b do not.)
For optimal accuracy, we recommend using:
- Crosswalks from blocks for short-form decennial census data
- Crosswalks from block group parts for long-form 1990 and 2000 census data
- Crosswalks from block groups for ACS 5-year data
- Crosswalks from census tracts only for data that are not available for lower levels
How to Use the Crosswalks
Using Crosswalks from Blocks
In a crosswalk from blocks, each record identifies a possible intersection between a single source block and a single target zone, along with an interpolation weight (ranging between 0 and 1) identifying approximately what portion of the source block's population and housing units were located in the intersection. These weights can be used to estimate how any counts available for source blocks (e.g., females age 75 and over, single-member households, owner-occupied housing units, etc.) are distributed among target zones.
For example, to interpolate count data from 1990 blocks to 2010 census tracts:
- Obtain data of interest for 1990 blocks
- For example, using the NHGIS Data Finder, find and download tables for the Block geographic level for the year 1990 (dataset 1990_STF1)
- Get the 1990-block-to-2010-census-tract crosswalk from the Crosswalks to Census Tracts section of this page
- Join the crosswalk to the 1990 block data
- Multiply the 1990 block counts by the crosswalk's interpolation weights
- This produces estimated counts for all intersections (or "atoms") between 1990 blocks and 2010 census tracts
- Sum these atom counts for each 2010 census tract
- This produces estimated 1990 counts for all of the 2010 census tracts identified in the crosswalk
Using Crosswalks from Block Group Parts, Block Groups & Census Tracts
The steps for using crosswalks from block group parts (BGPs), block groups, and tracts mirror those for crosswalks from blocks. To follow the example there, you can generally just substitute your chosen source zones (e.g., 1990 BGPs) for "1990 blocks" and substitute your chosen target zones for "2010 census tracts."
The main difference is that crosswalks from BGPs, block groups, and tracts include separate interpolation weights for different census counts, as laid out in the Interpolation Weights section of the Technical Details below. To generate the weights in these crosswalks, we compute the proportion of each source zone's characteristics in each target zone based on block-level characteristics, using the crosswalks from blocks. The separate interpolation weights are based on different block-level characteristics (total population, total housing units, etc.), enabling crosswalk users to choose the weights that are most suitable for their data of interest.
For example, a user interpolating counts of foreign-born persons may choose to use the weights based on total populations, assuming that the distribution of foreign-born persons corresponds closely to the general population's distribution. A user interpolating counts of high-income households may instead choose to use the weights based on total households, etc.
Block Group Parts: What They Are & How to Get Data for Them
What are block group parts?
NHGIS uses the term "block group parts" (BGPs) to refer to a type of compound geographic level that consists of the intersections between block groups, places, county subdivisions, and any other standard census summary levels.
The Census Bureau has published data tables for some form of BGPs for each decennial census since 1970.
Why do the NHGIS crosswalks from 1990 and 2000 use BGPs and not block groups?
It is generally most accurate to crosswalk from the smallest possible units. In the 1990 and 2000 census datasets in NHGIS, there are no tables available for block groups that are not also available for BGPs, so for these years, we know of no situation in which it would be necessary to start from block groups instead of more accurately starting from the smaller BGPs.
How can I get data for BGPs?
You can get data tables for BGPs, as you can for many other levels, through the NHGIS Data Finder. Because BGPs are a compound level, finding data for them involves one important extra step. When viewing a selection window for Geographic Levels in the Data Finder, you will need to click on the "Show Compound Geographic Levels" option in the upper right. You will then find BGP levels under the "BLOCK GROUP" heading.
Which specific types of BGPs are used in NHGIS crosswalks?
Summary files for 1990 and 2000 use different versions of BGPs, each combining different sets of geographic units. The crosswalks use these levels:
Year | NHGIS ID | Label |
|---|---|---|
1990 | blck_grp_598 | Block Group [1990 partition] (by State--County--County Subdivision--Place/Remainder--Census Tract--Congressional District (1987-1993, 100th-102nd Congress)--American Indian/Alaska Native Area/Remainder--Reservation/Trust Lands/Remainder--Alaska Native Regional Corporation/Remainder--Urbanized Area/Remainder--Urban/Rural) |
2000 | blck_grp_090 | Block Group [2000-2020 partition] (by State--County--County Subdivision--Place/Remainder--Census Tract--Urban/Rural) |
Using Block-to-Block Crosswalks to Generate Data for Any Larger Units
If you need crosswalks for geographic levels that aren't covered in the current set of NHGIS crosswalks, you may still be able to use the block-to-block crosswalks to produce the data you need.
Since 1990, every census geographic unit corresponds exactly to a set of blocks from the same census year. If you have census counts for blocks, you can compute counts for any larger census units (congressional districts, American Indian / Alaska Native / Hawaiian Home Land areas, etc.) by summing all the counts for blocks in that unit. In this way, the NHGIS block-to-block crosswalks can be used to allocate data from 1990, 2000 or 2020 to any 2010 census units, or from 2010 to any 2020 census units, not just to blocks.
For example, to compute 2000 counts for 2010 school districts:
- Obtain 2000 block counts of interest and use the 2000-to-2010 block crosswalk to generate 2000 data for 2010 blocks (following steps similar to those above)
- Obtain a 2010 block data table from NHGIS and join it to the 2000 counts from step 1
- You can find codes for most 2010 census units, including school districts, in 2010 block-level table files
- Sum the 2000 counts for all 2010 blocks in each 2010 school district
Technical Details
Basics
The crosswalks are provided through the links below as comma-separated values (CSV) files within Zip archives.
Each Zip file includes a copy of this README text file, which describes the structure and content of the crosswalk files in detail.
Methodology
The interpolation weights in NHGIS crosswalks from blocks to blocks are primarily based on "target-density weighting" (TDW) (Schroeder 2007). TDW assumes that characteristics within each source zone have a distribution proportional to the densities of another characteristic among target zones. For example, if a 2020 block intersects two 2010 blocks, one of which was 10 times as dense as the other in 2010, then TDW assumes that the same 10:1 ratio holds within the 2020 block in 2020.
The interpolation weights in the crosswalks from 1990 and 2000 blocks to 2010 blocks involve some more advanced modeling as documented in these pages:
To generate weights in crosswalks from blocks to larger areas, we sum the weights from the block-to-block crosswalks for each pairing of source block and target zone. For example, if a single 1990 block intersects three 2010 blocks, two of which were in a single 2010 tract, then for the 1990-block-to-2010-tract crosswalk, we sum the two weights for the intersections between the 1990 block and the two 2010 blocks in the same 2010 tract.
To generate all other crosswalks, we use block-level data and the block-to-block crosswalks to compute the proportion of each source zone's characteristics that were located in each target zone. For example, to compute the household interpolation weights in crosswalks from 2010 block groups (BGs) to 2020 census tracts, we:
- Apply the weights in the 2010-to-2020-block crosswalk to 2010 block-level household counts to compute counts of 2010 households in all intersections between 2010 and 2020 blocks
- Sum the block-level-intersection counts for each unique combination of 2010 BG ID and 2020 tract ID to compute counts of 2010 households in each intersection between 2010 BGs and 2020 tracts
- Divide each of these "intersection counts" by the total household count for the corresponding 2010 BG to compute the expected proportion of the 2010 BG's households that are located in each 2020 tract
Geographic Coverage
Each crosswalk file is complete for the entire U.S. or for an entire state. State-level files include all target zones for the state as well as any source zones that intersect any of those target zones, including some source zones from neighboring states in cases where the Census Bureau adjusted state boundary lines between censuses.
Users interested in producing a complete set of data for a single state may need to obtain source data for both the state of interest and its neighboring states to ensure they have the required input data to allocate to all target zones in the state.
The block crosswalks and the nationwide BGP crosswalks can include millions of records and may therefore be too large to open in some applications.
Geographic Identifiers
The crosswalk files include two types of zone identifiers:
- GISJOIN
- Standard identifier used in NHGIS data tables and boundary files
- Always begins with a "G" prefix*
- The NHGIS state and county codes in GISJOIN identifiers are based on FIPS codes with one digit added to differentiate historical areas
- For current states and counties, the NHGIS code matches the FIPS code with a "0" appended
- GEOID
- Standard identifier used in recent Census Bureau source files
- May begin with a leading zero, which software applications commonly drop when reading the data*
For specifications of how these identifiers are constructed for different geographic levels and years, see the Zone Identifiers section in the crosswalk README file.
*Leading zeros & storing identifiers as text vs. numbers: By default, many software applications read and store numeric codes as numbers, which drops any leading zeros. E.g., the state FIPS code for Colorado officially consists of two digits, "08", but applications will commonly read and store this as the number 8. The purpose of the "G" prefix in GISJOIN identifiers is to ensure applications store identifiers as text strings.
Preserving leading zeros is important when concatenating codes to create a unique identifier. E.g., to uniquely identify Adams County, Colorado, the standard approach is to concatenate the Colorado code (FIPS "08" or NHGIS "080") with the Adams County code (FIPS "001" or NHGIS "0010"), yielding "08001" (the GEOID) or "G0800010" (the GISJOIN), which is unique among all U.S. counties. If the codes were stored as numbers (e.g., 8 for Colorado and 1 for Adams County), proper concatenation would require additional processing to re-insert leading zeros. Preserving leading zeros is also helpful when parsing concatenated identifiers to extract a single geographic level's code (e.g., to obtain the state code "08" from "08001").
How identifiers are stored is important when joining two data tables. Applications are typically not able to directly match numeric identifiers in one table with text identifiers in another table.
We recommend using GISJOIN identifiers not only for joining across various NHGIS data types (crosswalks, tables, boundary files) but also to help ensure that applications properly store the identifiers as text without dropping leading zeros.
Interpolation Weights
The block crosswalks include a single interpolation weight (labeled "weight") representing the expected proportion of the source block's population and housing units located in each target zone. These are the weights used for geographically standardized time series tables.
The crosswalks from larger units (BGPs, block groups, and census tracts) include multiple interpolation weights, as discussed above:
Field Name | Description |
|---|---|
wt_pop | Expected proportion of source zone's population located in target zone |
wt_adult | Expected proportion of source zone's adult population (18 years and over) located in target zone. |
wt_fam | Expected proportion of source zone's families located in target zone. |
wt_hh | Expected proportion of source zone's households located in target zone. Note: household counts are equal to counts of occupied housing units and of householders. |
wt_hu | Expected proportion of source zone's housing units located in target zone |
wt_ownhu | Expected proportion of source zone's owner-occupied housing units located in target zone |
wt_renthu | Expected proportion of source zone's renter-occupied housing units located in target zone |
Blank/Missing Identifiers
In crosswalks with 1990 source zones, the 1990 zone identifier fields may contain blank values. Blank values are given in cases where a 1990 zone lies entirely offshore in coastal or Great Lakes waters. In these cases we are unable to use NHGIS boundary files, which exclude offshore areas, to determine relationships between 1990 and later census zones. (For censuses after 1990, we use block relationship files from the Census Bureau to identify intersections in offshore areas.) It is safe to assume that the target zones that lack a matching 1990 zone contain no 1990 population or housing units. We include the records with blank 1990 identifiers to ensure that all target zones are represented in the file.
Downloads
Crosswalks to Blocks
To 2010 Blocks:
1990 Blocks → 2010 Blocks
2000 Blocks → 2010 Blocks
2020 Blocks → 2010 Blocks
To 2020 Blocks:
2010 Blocks → 2020 Blocks
Crosswalks to Block Groups
From Blocks
Optimal for short-form census data.
To 2010s Block Groups:
1990 Blocks → 2010s Block Groups
National Files: | ||
|---|---|---|
Arizona: | ||
California: | ||
South Dakota: | ||
Virginia: | ||
New York: | ||
2000 Blocks → 2010s Block Groups
National Files: | ||
|---|---|---|
Arizona: | ||
California: | ||
South Dakota: | ||
Virginia: | ||
New York: | ||
2020 Blocks → 2010s Block Groups
National Files: | ||
|---|---|---|
Arizona: | ||
California: | ||
South Dakota: | ||
Virginia: | ||
New York: | ||
To 2020s Block Groups:
2010 Blocks → 2020s Block Groups
National Files: | ||
|---|---|---|
Connecticut: | ||
From Block Groups or Block Group Parts
Optimal for long-form data.
To 2010s Block Groups:
1990 Block Group Parts → 2010s Block Groups
National Files: | ||
|---|---|---|
Arizona: | ||
California: | ||
South Dakota: | ||
Virginia: | ||
New York: | ||
2000 Block Group Parts → 2010s Block Groups
National Files: | ||
|---|---|---|
Arizona: | ||
California: | ||
South Dakota: | ||
Virginia: | ||
New York: | ||
2020s Block Groups → 2010s Block Groups
National Files: | ||
|---|---|---|
Arizona: | ||
California: | ||
Connecticut: | ||
South Dakota: | ||
Virginia: | ||
New York: | ||
To 2020s Block Groups:
2010s Block Groups → 2020s Block Groups
National Files: | ||
|---|---|---|
Arizona: | ||
California: | ||
Connecticut: | ||
South Dakota: | ||
Virginia: | ||
New York: | ||
Crosswalks to Census Tracts
From Blocks
Optimal for short-form census data.
To 2010s Census Tracts:
1990 Blocks → 2010s Census Tracts
National Files: | ||
|---|---|---|
Arizona: | ||
California: | ||
South Dakota: | ||
Virginia: | ||
New York: | ||
2000 Blocks → 2010s Census Tracts
National Files: | ||
|---|---|---|
Arizona: | ||
California: | ||
South Dakota: | ||
Virginia: | ||
New York: | ||
2020 Blocks → 2010s Census Tracts
National Files: | ||
|---|---|---|
Arizona: | ||
California: | ||
South Dakota: | ||
Virginia: | ||
New York: | ||
To 2020s Census Tracts:
2010 Blocks → 2020s Census Tracts
National Files: | ||
|---|---|---|
Connecticut: | ||
From Block Groups or Block Group Parts
Optimal for long-form data.
To 2010s Census Tracts:
1990 Block Group Parts → 2010s Census Tracts
National Files: | ||
|---|---|---|
Arizona: | ||
California: | ||
South Dakota: | ||
Virginia: | ||
New York: | ||
2000 Block Group Parts → 2010s Census Tracts
National Files: | ||
|---|---|---|
Arizona: | ||
California: | ||
South Dakota: | ||
Virginia: | ||
New York: | ||
2020s Block Groups → 2010s Census Tracts
National Files: | ||
|---|---|---|
Arizona: | ||
California: | ||
Connecticut: | ||
South Dakota: | ||
Virginia: | ||
New York: | ||
To 2020s Census Tracts:
2010s Block Groups → 2020s Census Tracts
National Files: | ||
|---|---|---|
Arizona: | ||
California: | ||
Connecticut: | ||
South Dakota: | ||
Virginia: | ||
New York: | ||
From Census Tracts – LEAST ACCURATE OPTION FOR TRACT DATA
It is significantly more accurate to use the above crosswalks from smaller units to census tracts. For example, to produce the most accurate 1990 race counts for 2010 census tracts, you should get 1990 block-level race counts and use a crosswalk from 1990 blocks to 2010 tracts rather than using 1990 tract-level counts with a tract-to-tract crosswalk. We recommend using tract-to-tract crosswalks only if the data of interest are not available at lower levels. Otherwise, your estimates will be unnecessarily inaccurate.
To 2010s Census Tracts:
1990 Census Tracts → 2010s Census Tracts
National Files: | ||
|---|---|---|
Arizona: | ||
California: | ||
South Dakota: | ||
Virginia: | ||
New York: | ||
2000 Census Tracts → 2010s Census Tracts
National Files: | ||
|---|---|---|
Arizona: | ||
California: | ||
South Dakota: | ||
Virginia: | ||
New York: | ||
2020s Census Tracts → 2010s Census Tracts
National Files: | ||
|---|---|---|
Arizona: | ||
California: | ||
Connecticut: | ||
South Dakota: | ||
Virginia: | ||
New York: | ||
To 2020s Census Tracts:
2010s Census Tracts → 2020s Census Tracts
National Files: | ||
|---|---|---|
Arizona: | ||
California: | ||
Connecticut: | ||
South Dakota: | ||
Virginia: | ||
New York: | ||
Crosswalks to Core Based (Metropolitan/Micropolitan) Statistical Areas (ZCTAs)
These crosswalks are provided only in nationwide files with no state-specific files because some ZCTAs straddle state boundaries.
The "2010 ZCTAs" here correspond to the December 2009 ZCTA definitions, and the "2020 ZCTAs" correspond to the March 2020 ZCTA definitions, as used in data releases from the 2010 and 2020 ACS and decennial censuses.
- To 2010 ZCTAs
- To 2020 ZCTAs
Crosswalks to Counties
From Blocks
Optimal for short-form census data.
To 2010s Counties:
1990 Blocks → 2010s Counties
National Files: | ||
|---|---|---|
South Dakota: | ||
Virginia: | ||
2000 Blocks → 2010s Counties
National Files: | ||
|---|---|---|
South Dakota: | ||
Virginia: | ||
2020 Blocks → 2010s Counties
National Files: | ||
|---|---|---|
Arizona: | ||
California: | ||
South Dakota: | ||
Virginia: | ||
New York: | ||
To 2020s Counties:
2010 Blocks → 2020s Counties
National Files: | ||
|---|---|---|
Connecticut: | ||
From Block Groups or Block Group Parts
Optimal for long-form data.
To 2010s Counties:
1990 Block Group Parts → 2010s Counties
National Files: | ||
|---|---|---|
South Dakota: | ||
Virginia: | ||
2000 Block Group Parts → 2010s Counties
National Files: | ||
|---|---|---|
South Dakota: | ||
Virginia: | ||
2020s Block Groups → 2010s Counties
National Files: | ||
|---|---|---|
Connecticut: | ||
South Dakota: | ||
Virginia: | ||
To 2020s Counties:
2010s Block Groups → 2020s Counties
National Files: | ||
|---|---|---|
Connecticut: | ||
South Dakota: | ||
Virginia: | ||
From Census Tracts – Least Accurate Option
It is more accurate to use the above crosswalks from smaller units when possible.
To 2010s Counties:
1990 Census Tracts → 2010s Counties
National Files: | ||
|---|---|---|
South Dakota: | ||
Virginia: | ||
2000 Census Tracts → 2010s Counties
National Files: | ||
|---|---|---|
South Dakota: | ||
Virginia: | ||
2020s Census Tracts → 2010s Counties
National Files: | ||
|---|---|---|
Connecticut: | ||
South Dakota: | ||
Virginia: | ||
To 2020s Counties:
2010s Census Tracts → 2020s Counties
National Files: | ||
|---|---|---|
Connecticut: | ||
South Dakota: | ||
Virginia: | ||
Crosswalks to County Subdivisions
To 2010 County Subdivisions:
1990 Blocks → 2010 County Subdivisions
2000 Blocks → 2010 County Subdivisions
2020 Blocks → 2010 County Subdivisions
To 2020 County Subdivisions:
2010 Blocks → 2020 County Subdivisions
Crosswalks to Places
To 2010 Places:
1990 Blocks → 2010 Places
2000 Blocks → 2010 Places
2020 Blocks → 2010 Places
To 2020 Places:
2010 Blocks → 2020 Places
Crosswalks to Public Use Microdata Areas (PUMAs)
To 2010 PUMAs:
1990 Blocks → 2010 PUMAs
2000 Blocks → 2010 PUMAs
2020 Blocks → 2010 PUMAs
To 2020 PUMAs:
2010 Blocks → 2020 PUMAs
IPUMS USA also provides crosswalks between 2000 and 2010 PUMAs and between 2010 and 2020 PUMAs.
Crosswalks to Urban Areas
These crosswalks are provided only in nationwide files with no state-specific files because some urban areas straddle state boundaries.
- To 2010 Urban Areas
- To 2020 Urban Areas
Crosswalks to 5-Digit ZIP Code Tabulation Areas (ZCTAs)
These crosswalks are provided only in nationwide files with no state-specific files because some ZCTAs straddle state boundaries.
- To 2010 ZCTAs
- To 2020 ZCTAs
Download via API
Users who would like to access NHGIS crosswalks directly from within a programming environment (R, Python, etc.) may use the IPUMS API. The IPUMS Developer Portal provides complete details on the IPUMS API. The API for IPUMS NHGIS page describes which NHGIS supplemental data resources are available through the API (including crosswalks) and identifies how to construct a valid API URL for these resources. The Workflows & Code pages include some example code for accessing NHGIS supplemental data.
Citation and Use
Use of NHGIS crosswalks is subject to the same conditions as for all NHGIS data. See Citation and Use of NHGIS Data.
References
- ^ Schroeder, J. P. (2007). "Target-density weighting interpolation and uncertainty evaluation for temporal analysis of census data." Geographical Analysis 39(3), 311–335. http://dx.doi.org/10.1111/j.1538-4632.2007.00706.x